Do you know where your visitors are coming from on your website and would you like to know where users are based and who is visiting your website? Using Google Analytics can help you with these problem.
There are millions of websites out there, and tracking how people are getting to your site and what’s performing well is a must for being competitive in the online marketplace.
Google Analytics makes it easy for anyone to manage a site, to track and analyse this data. Google Analytics is free, powerful tool that can answer your questions of where and how users are getting to your website.
First you will need to learn some basic Google Analytics terms, which will enable you to understand the data analysis the tool is displaying about your account.
- Pages/sessions – Pages/session (Average Page Depth) is the average number of pages viewed during a session. Repeated views of a single page are counted.
- Bounce Rate – Bounce rate is the percentage of single-page visits (i.e. Visits in which the person left your site from the entrance page without interacting with the page).
- Sessions – A session is the period of time a user is actively engaged with your website, app, etc., within a date range. All usage data (Screen views, Events, Ecommerce, etc.) is associated with a session.
- Users – Users who have had at least one session within the selected date range. Includes both new and returning users.
- Session Duration – The average length of a session.
Setting up Google Analytics
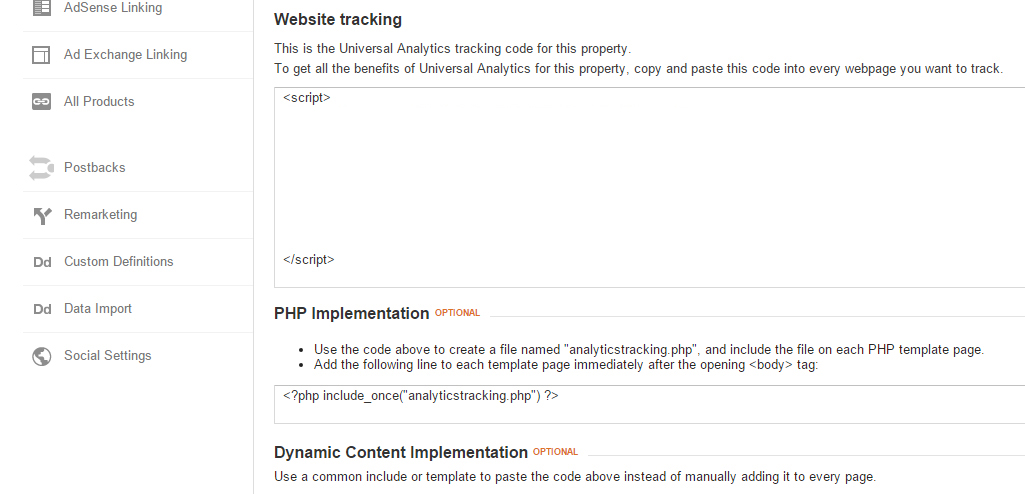
Once you have set up Google Analytics you will need to insert a code into your website. If you are using a Content Management System like WordPress, for example, you can use the Yoast plugin ‘Analytics’. You can link your account up with ‘Analytics’, which will put the codes into your website.
If your site is custom-built, you’ll either need to implement the code on each page manually, or speak to your web developer about how the site generates content.
Copy the JavaScript code from Analytics and paste it just above the </head> tag in your page or template. Adding this code will not affect the look of your site.
Adjusting the time range.
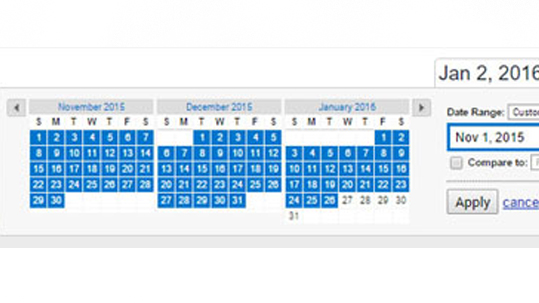
 With Google Analytics you can adjust the time range in the upper right hand corner that you want data from. You can adjust this to track weekly, daily or monthly whatever time frame works best for you. In the dates area you also tick compare, so you can equate one weekend to another weekend or the first month of the month to last Monday of the Monday.
Real Time
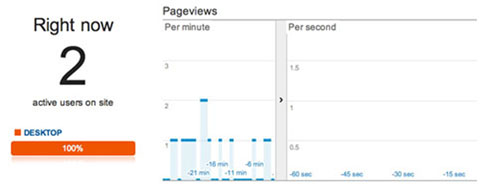 Want to know how your site is preforming right now this second. Real-Time data gives you access to that data instantly.
You can see the current visitor’s page views, active pages and locations.
Audience Location
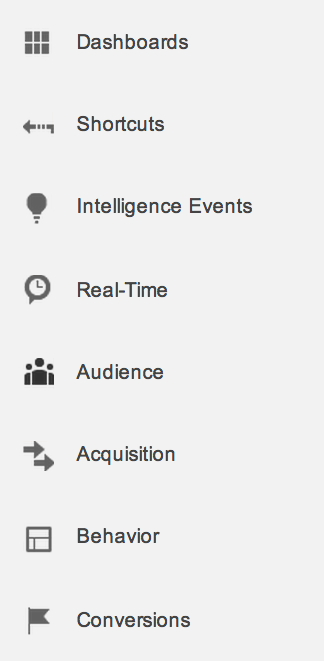 One of the main things we get asked, is where are the people that viewing our website and there location. To view this information on the left hand side you have long menu bar.
Click on Audience and overview. On the right main screen area you will now get a graph of the views for the date period you picked. Below you
will have ‘ Demographics’ click on country and this will give you all the counties your website has been viewed by. Below Country is ‘City’ this will give you more detail on cities your website has been viewed by.
I hope this has given you a good feel for navigating around your Google Analytics data. If you have any comments on Google Analytics, which you would like us to cover for the next post. You can forward them on to us below or email them us and we will cover them in the next one.

